Hello All!
Note for all about Trading: Just in case you have or hopefully have not gotten bit by the “Wash-Sale” bug, something not any stocks you buy especially when grabbing for the “BIG” dividend and turn around and sell a day or 2 later and buy back, for next weeks dividends, you must wait for 30 business days before re-buying. This applies to anyone who is not a “Qualified Day Trader” so please keep this in mind, it is one core idea behind the next 5 weeks..
As we all know, YieldMax has changed all of their ETF’s to weekly pay! so what can we expect? let’s first reflect on our history of the monthly ETF’s we have been tracking, reporting, buying and enjoying the profits/losses from…. yeah I know nobody enjoys losses, well except in this at tax time to offset some of the gains. Of course YieldMax has shielded us from most of the gains in the case of the dividends (make sure to talk with your tax pro on this…).
So here we are;
In some cases like MSTY, CONY, TSLY & etc. we have seen the purchase price drop dramatically, while the dividends still remain fairly reasonable, some of us have focused more on the weekly payer groups and accepted lower overall dividend amount per month, but more consistent or less fluctuation in the price per share and dividend per share payout. For YieldMax it may represent more cost per share for Gross Expense Ratio/Net Expense Ratio, this however is just something to watch.
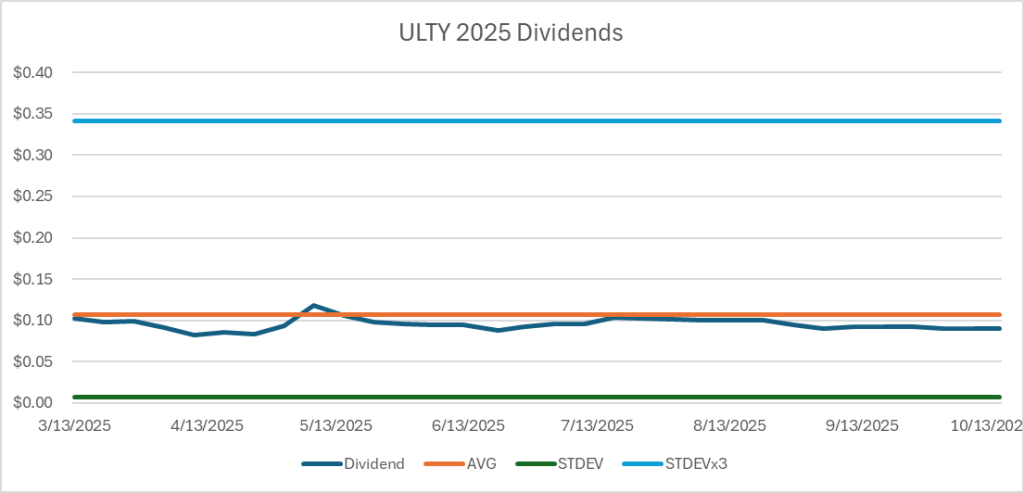
In response to one of Clint’s News Letters I comments to make sure to watch for the next 5 weeks before making any major purchase for the ETF ticker that have updated from Monthly to Weekly and noted that statistically we need 5 data points to build an average. So below I have created 2 graphs of results to date in 2025 of ULTY & MSTY. In which there are 4 pieces of data. Let me explain (pardon me if you know this already) on the charts in the Y axis (upward numbers) are automatic based on data, X axis are the date from which we took the data, Dividend in dark blue is the actual data from dividendhistory.org, AVG or Average is all the data points averaged by population statistically (which is different from taking 1+1+1=3 / 3), STDEV or Standard Deviation, this is the difference between the AVG in the data, and last is +3 STDEV this is the maximum difference between the AVG and any outlaying data points (calculated by, AVG + STDEV x 3).
OK now let me break all that mumbo jumbo down a bit! (HA!) when ever we are looking at data and need to know positively that we can trust is we use this format. The terms STDEV & +STDEVx3 (there exist a -Stdevx3 also but the bottom of that data is zero which means we are not able to go that low) may seem strange if you have never been in a manufacturing environment, but they are extremely important and have major implications to the outcome of your product. How does that relate to us you ask yourself? What am I producing? $$ ChaChing! Knowing that your STDEV is very low (how much fluctuation you have from the average dividend in statistics puts your confidence level at 60%, knowing that the + or – STDEVx3 puts your confidence level @ 99.99%.
Again how does that relate to me? well first in the Case of the ULTY the average dividend is $0.11 this year (considering the last 2 months it is more like $0.09) and the STDEV is $0.01, if we look at the price per share it stays constant between $5.00 and $5.60, so this is very stable and for the price let’s you purchase a good quantity of share of a low cost and give good returns (for 100 shares $9.00/week, x52 weeks $468.00/yr) this is just an example take that number and multiply by 5, 10 or 20 times and calculate your yearly dividends return vs. investment.
Now it’s time to look at MSTY, this one have been up and down and now it’s a weekly, whew! that chart looks different and that why it’s really important to wait those 5 weeks to decide to buy (more) or sell (some or all). If we use the same rational for STDEV and +STDEVx3, the STDEV for MSTY is $0.53 and +STDEVx3 is $5.77 is a much larger delta over this year, so what is going to happen now? the next 5 dividends will tell us!. The data in the graph excludes last weeks dividends as it is not representative of the MSTY dividend data going forward.

For my personal long term wealth goals, I want my ETF’s to provide the most consistent results, this helps budget what I can put in my pocket and how much I have to keep growing the portfolio. I hope everyone get some food for thought from this and we all get good rewards for our efforts! Please do not hesitate to reply or ask questions! I’ll keep the MSTY chart update over the next 5 weeks!
Regards,
Dwaine